
How we measured design system user satisfaction
We decided to drop quantitative surveys in favor of qualitative ones, but we didn't :) — we kept both research formats.
Like classic product teams, the DS team shapes its backlog from different channels, such as:
- Business requirements (from stakeholders)
- Our own vision
- User feedback
Today I want to talk about the last item on this list. At some point we ran into users being reluctant to share feedback, and I'll explain how we solved that problem.
What feedback collection looked like before
Once a quarter, we sent a Google survey to developers and designers with a set of questions asking them to rate their experience with the DS from 0 to 10 (NPS).
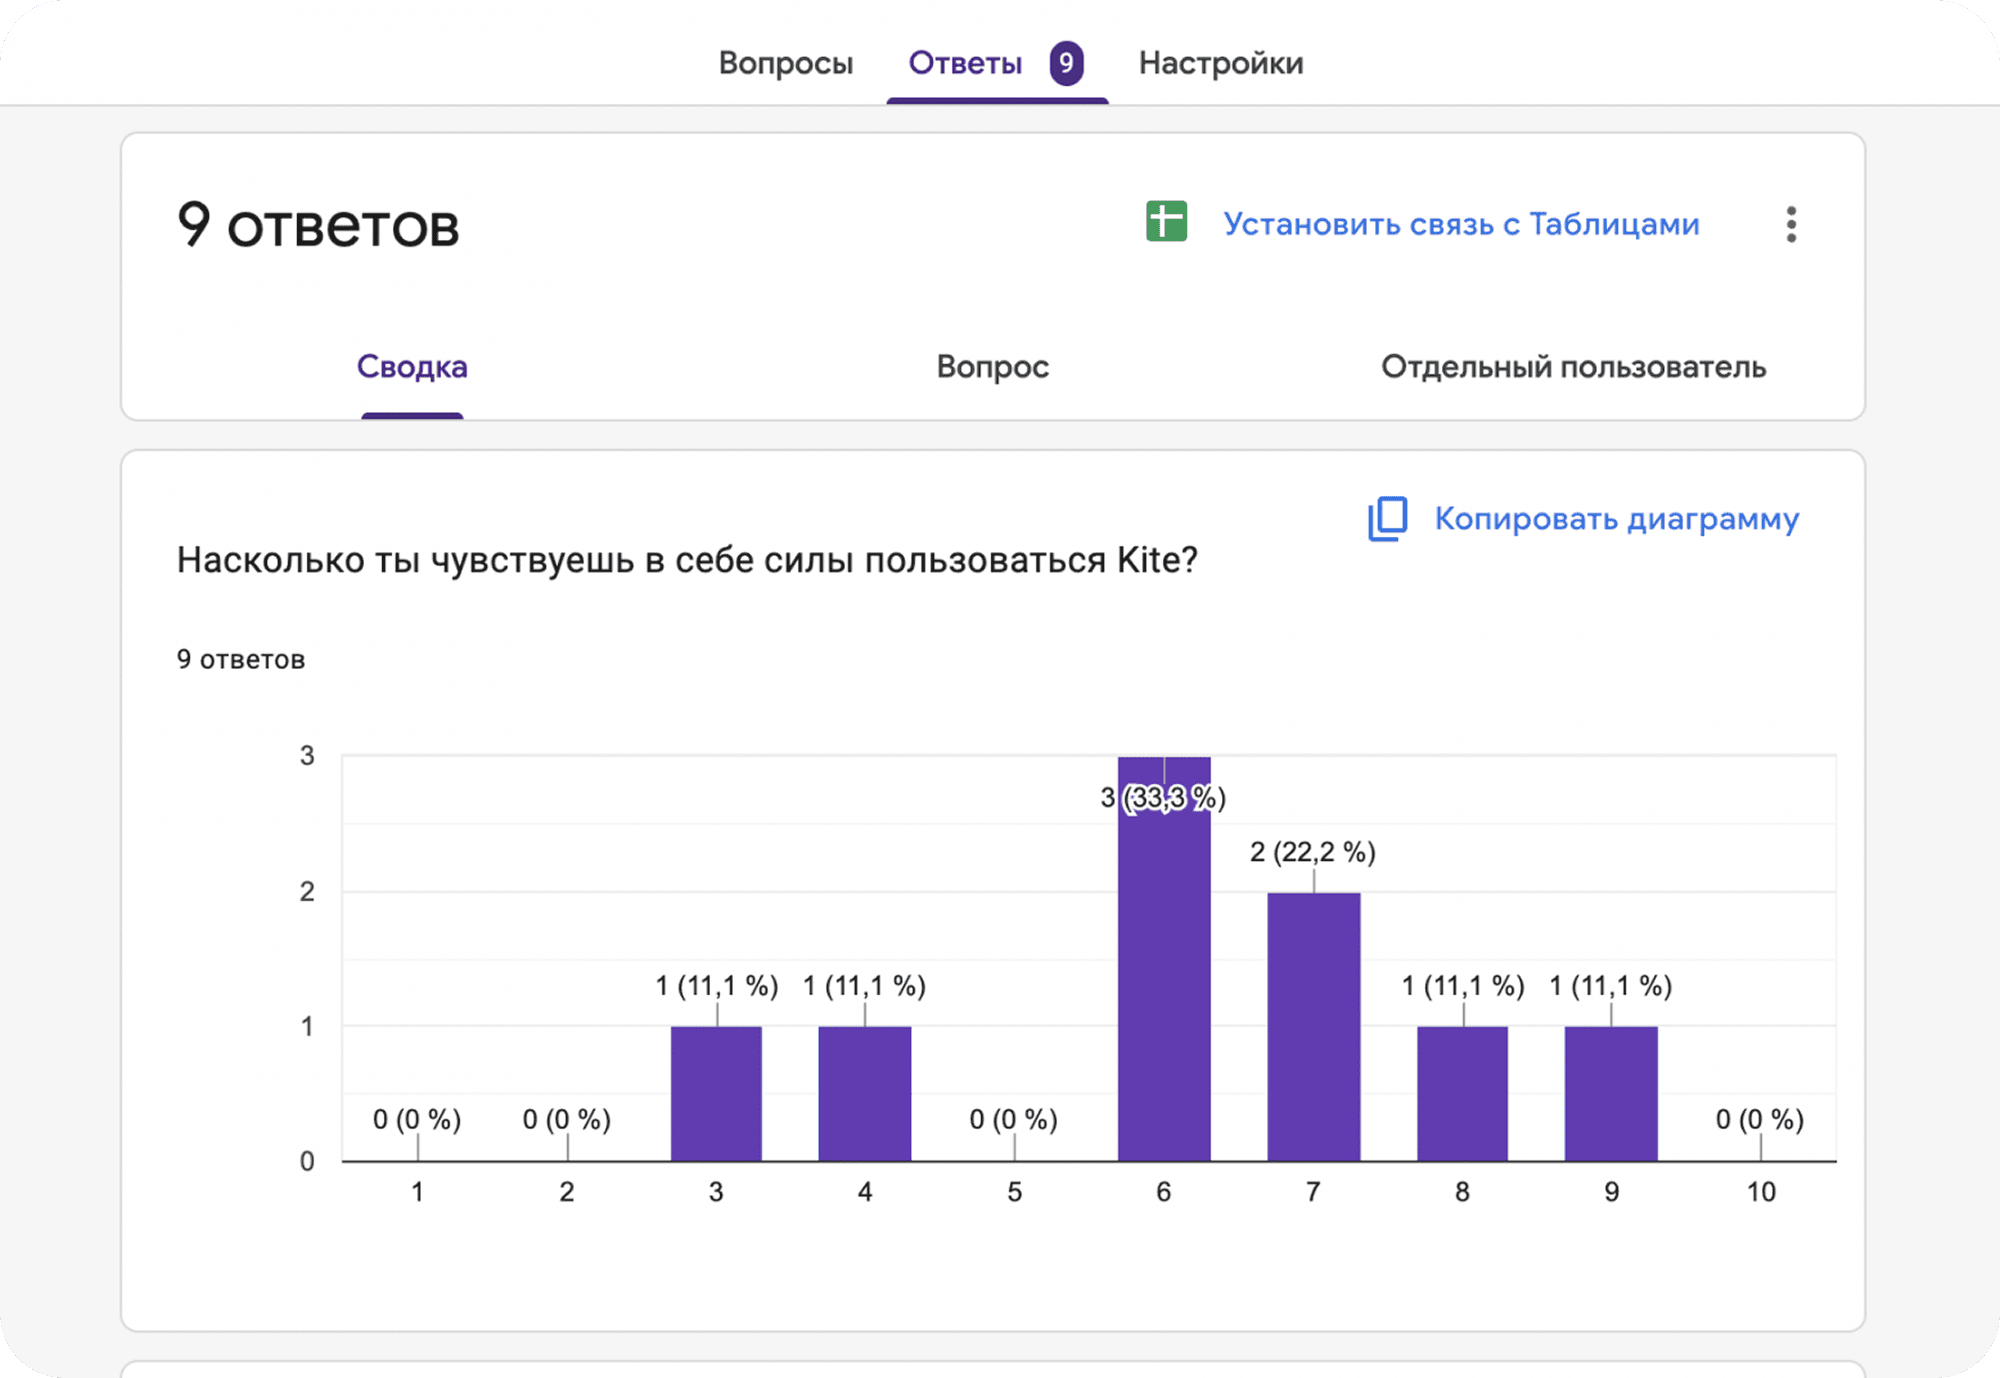
Once a quarter, we sent a Google survey to developers and designers with a set of questions asking them to rate their experience with the DS from 0 to 10 (NPS).
How clear is it for you to use Kite?
Do you have enough components and their capabilities to build your features?
How would you rate the quality of Kite components?
What difficulties do you face when using the design system?
and so on…In total, about 11 questions, each with a comment field, and some questions also had multiple-choice options.Very few users completed the surveys, persuasion didn't work, and we needed to fix that somehow.
Let's ask everyone!
We decided to interview every user personally and started with designers.We slightly changed the core questions. We also gained the ability to ask follow-up questions and dig deeper. A bit later we found a life hack: ask people to walk through the UI kit in Figma and go through the components. In those cases, users remembered moments they had already forgotten. Essentially, the goal was to bait them into a conversation :) After that, the story flowed, and all we had to do was capture everything on sticky notes and group it.
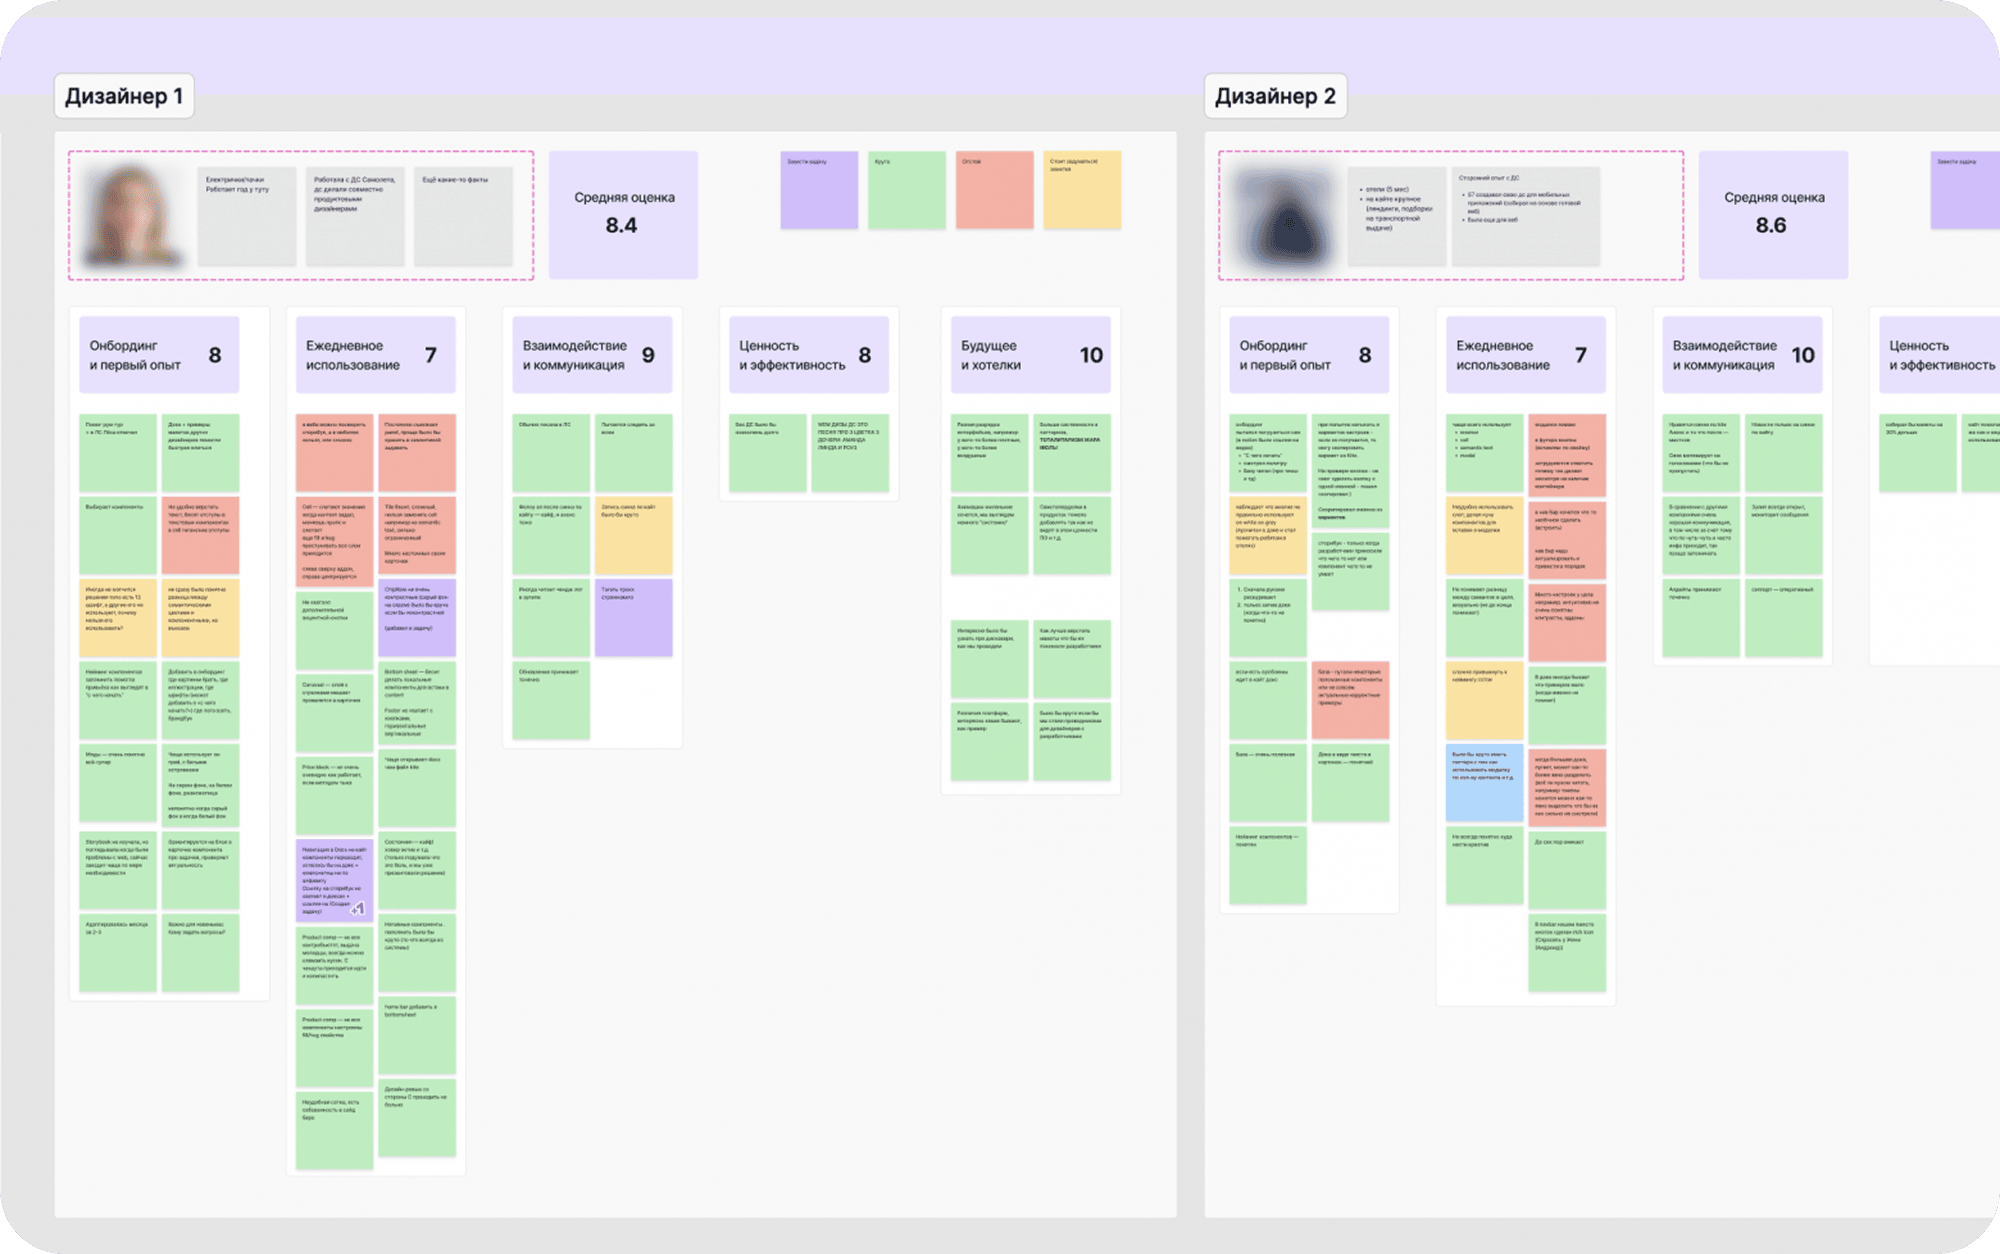
(Example report for each interviewee) (7 months)
At first, we grouped all insights into 5 categories:
- Onboarding — how quickly people ramped up, what was unclear at the start.
- Daily use — what problems they experience right now, "every day".
- Interaction and communication — how quickly they learn about updates and get answers to questions. In short, a block about support quality.
- Value and efficiency — here we tried to understand how they assess TTM themselves: whether features ship to production faster or not.
- Future and wishlist — we collected wishes and ideas :)
Blocks 4 and 5 originally had their own scoring questions, but we dropped them — they felt odd and too abstract.
What we learned:
We found that onboarding had dropped significantly, and made it our focus. Second in priority was improving daily use (mostly a few frequently used components were the pain points). We got a ton of insights we hadn't even suspected, collected many wishes and suggestions. In the end, we broke everything down into tasks and epics prioritized by frequency and severity of the problem.
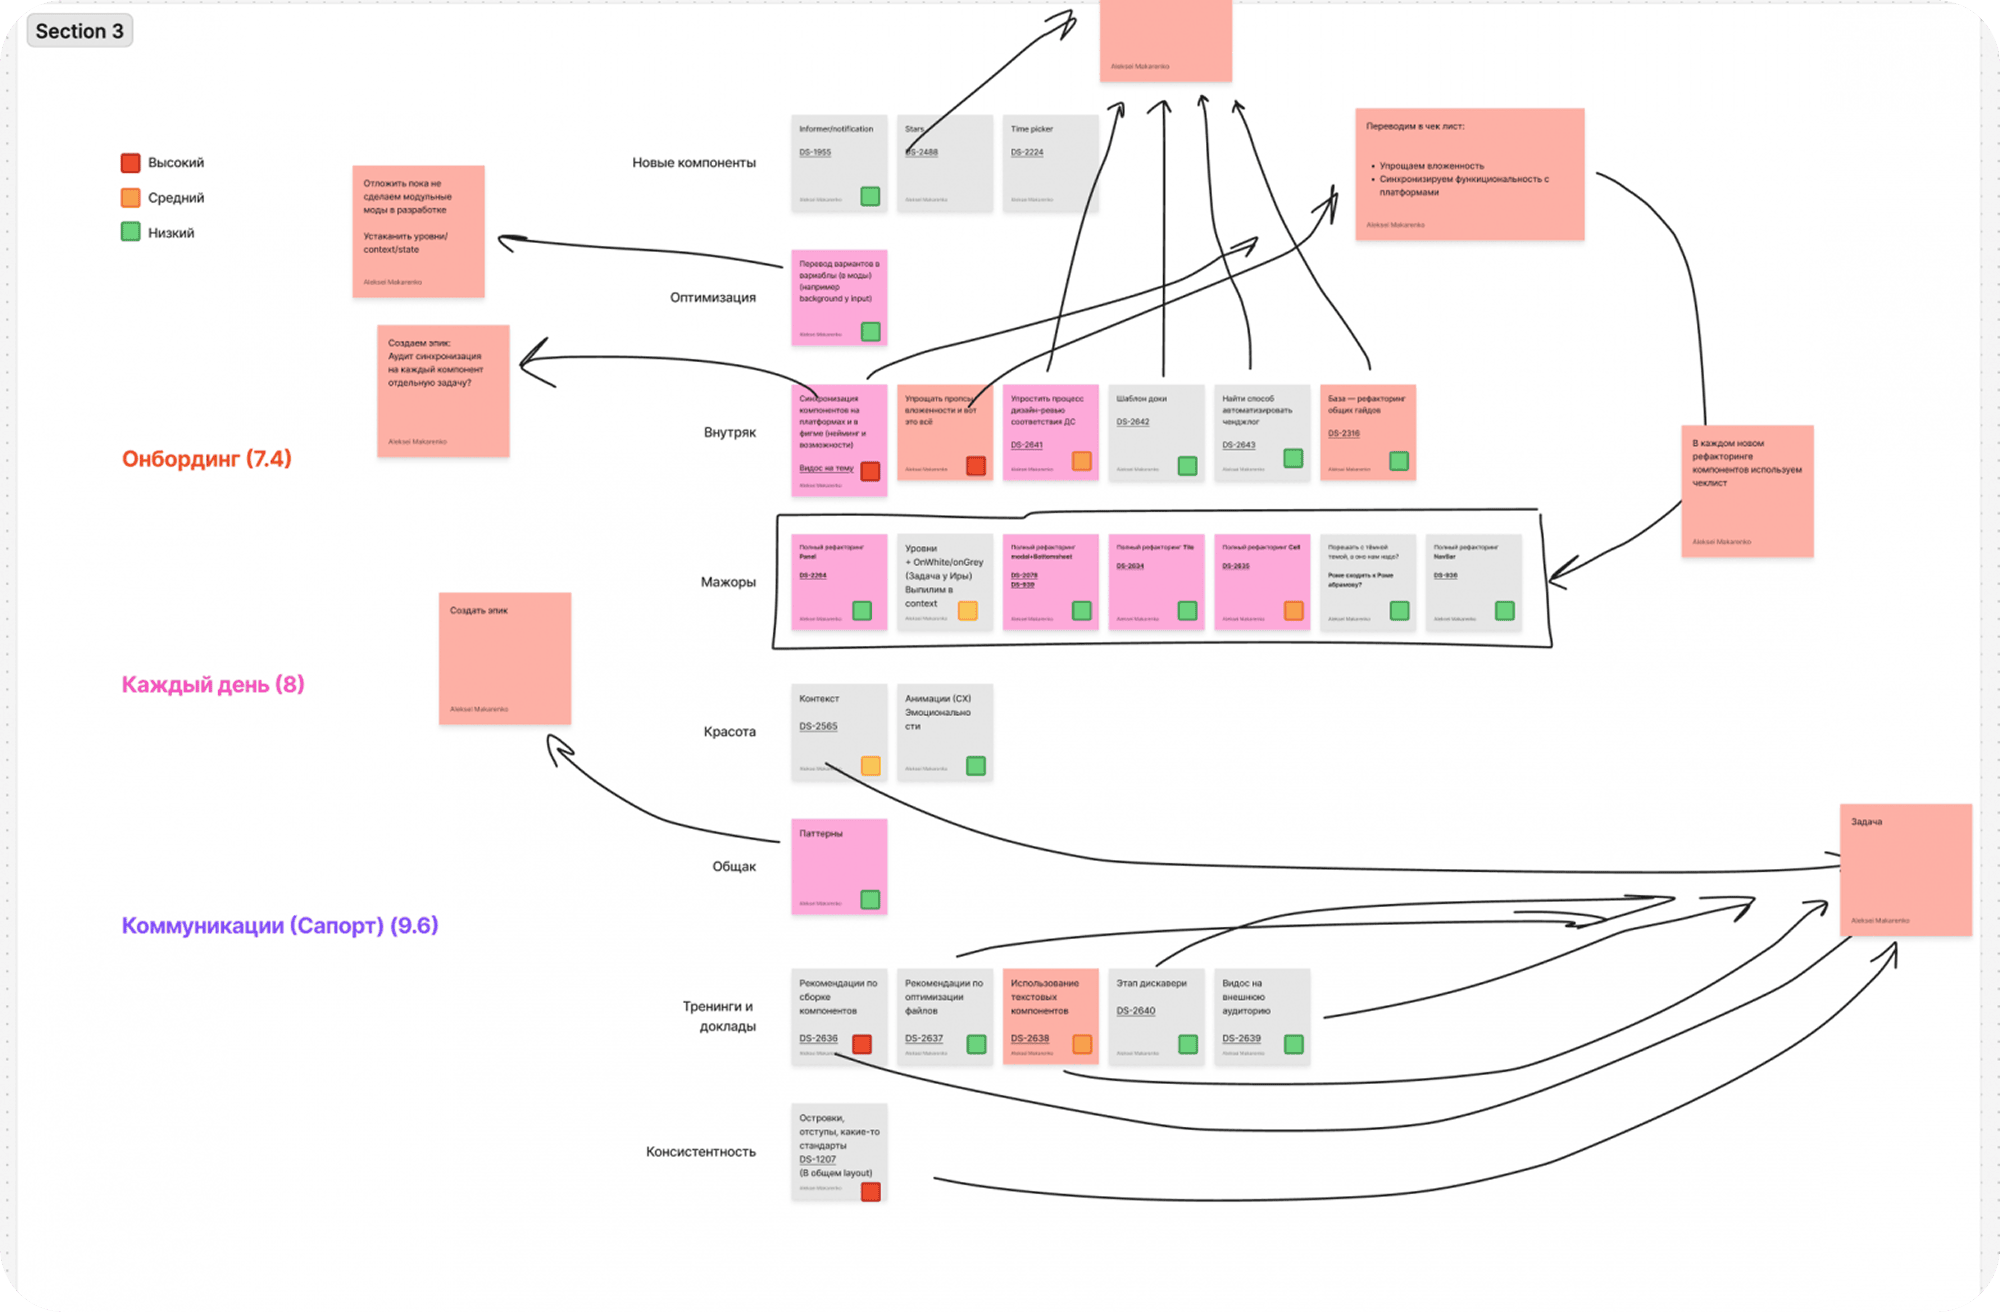
What feedback collection looks like now:
We defined 3 parameters we will measure:
- Onboarding
- Every day
- Communication
We decided to run in-depth interviews (those one-on-one sessions) twice a year, until Google survey participation improves (spoiler: the next survey had twice as many respondents!).We kept the Google Forms surveys, but significantly shortened them and focused only on these 3 main parameters. That made them as easy as possible to complete.
More cases

Design system for tutu.ru
This is an overview case describing what the design system consisted of, without unnecessary details. I will describe interesting parts in more detail later.

Design system for samokat.ru
b2b design system for mobile devices on iOS and Android in React Native, for internal systems, warehouses, dark stores, etc.